
I was excited when Twitter first announced that everyone had access to the analytics of their tweets, and loved it when they gave you the ability to download your entire Twitter history, but the analytics update they made today is AH-MAZING. I’m so excited about all of the new data available to me that I can hardly contain my excitement!
What’s so great about Twitter Analytics?
Actual Impressions
You read that right. Instead of estimating how many people saw your tweets by coming up with some weird algorithm, YOU NOW KNOW how many eyes were on your tweets! They give you a graph broken out by day:

*Note, this isn’t my account so I’ve hidden some numbers and identifying features for their sake – don’t want to give it ALL away!*
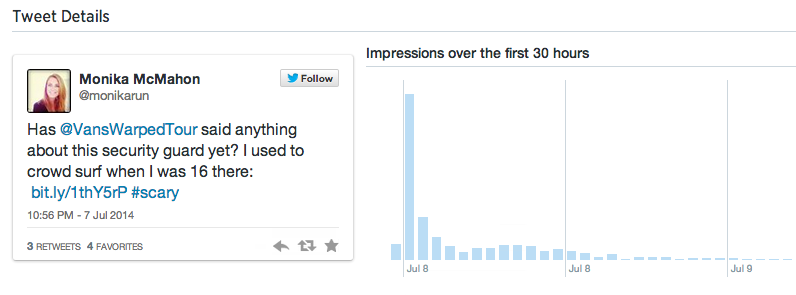
And also, you now have the ability to scroll through your ALL of your tweets to see which ones have higher impressions and more!! You can also click in to each Tweet for more specific details and information for impressions in the first 30 hours a tweet is live (must be the secret spot):
Engagement Rate
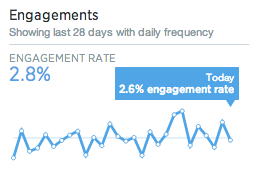
Not only can you see impressions, but you also have a graph of engagement rates over the past month:
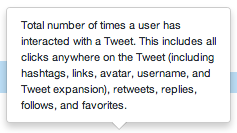
What is an engagement? I’ll let Twitter answer that one:
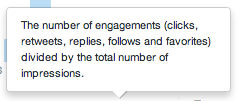
And engagement rate? Again, I’ll turn to Twitter for the explanation:
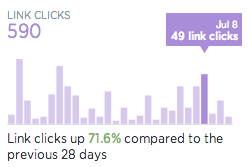
Link Clicks
They give you how many clicks happened each day on links you shared, along with a % growth over the last period:
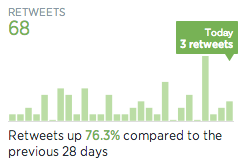
Retweets
Shows how many retweets per day and % growth:
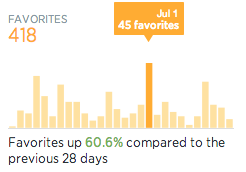
Favorites
Favorites per day and % growth:
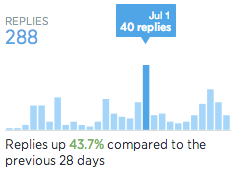
Replies
Number of replies you received per day along with % growth:
And that is just the information on the dashboard when you first log in to Analytics.Twitter.com. You can also export the data and go into MORE detail in Excel! That’s right folks, there is even more detail in the export.
You now have access to the following, per tweet (and even for all of your replies):
- impressions
- engagements
- engagement rate
- retweets
- replies
- favorites
- user profile clicks
- url clicks
- hashtag clicks
- detail expands
- permalink clicks
- embedded media clicks
- app opens
- app install attempts
- follows
- email tweet
- dial phone
That’s not all – if you do any promoted tweets, you ALSO get the info above as it pertains to your promoted tweets. I think I just had a datagasm. There is so much information here, my mind is going crazy with how this will help myself, work, band, brands, SpokesBUZZ, Noiselace and so much more!
I likely missed something new that they introduced today because I got too excited, but how will YOU be using all of this new social data?






Leave a Reply